
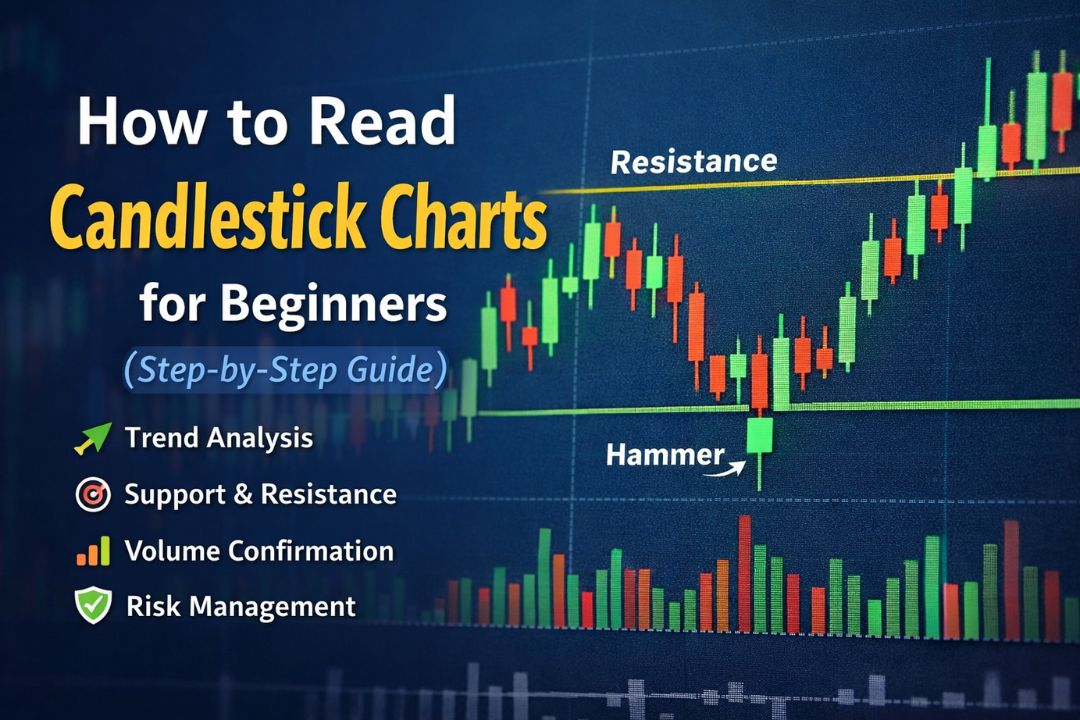
Introduction
Understand candlestick charts is one of the most important skills in stock market trading. Whether you are a novice investor, intraday trader, swing trader, or positional trader, candlestick charts help you understand price behavior clearly.
Prices are everything in trading.
Indicators come later. News comes later. Opinions come later.
But price showed through candlesticks tells the real story of buyers and sellers.
Candlestick charts help you:
- Understanding market psychology
- Identify trends
- Spot reversals
- Plan entry and exit
- Manage risk properly
If you master candlestick reading, you create a strong foundation for your trading journey.
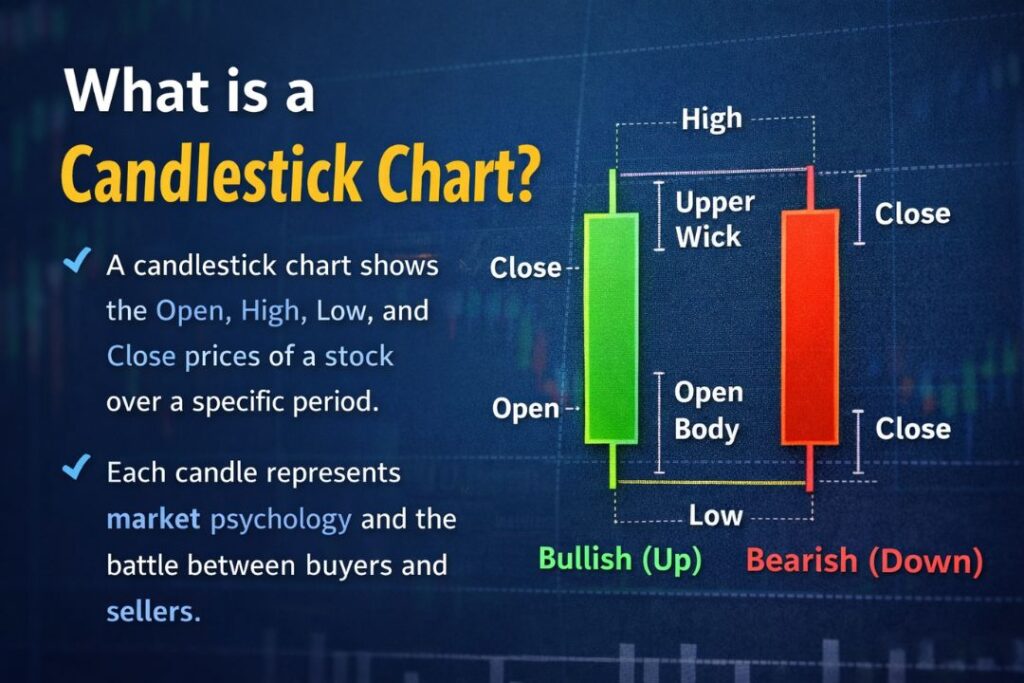
What is a Candlestick Chart?
A candlestick chart is a type of financial chart used to represent price movements of stocks, forex, crypto, commodities, or indicators over a specific period of time.
It was developed in Japan more than 200 years ago by a rice businessman named Munehisa Homma.
Each candlestick charts shows four significant prices:
- Open
- High
- Low
- Close
That is why it is also called OHLC representation.
Anatomy of a Candlestick
Every candlestick charts has three main parts:
1.Body
The thick rectangular part.
- Shows difference between open and close.
- If close open – bullish(usually green)
- If close open – bearish(usually red)
Large body=strong buying or selling pressure
Small body = indecision
2.Upper Shadow (Wick)
Thin line above body.
Shows highest price achieved during that time period.
Long upper wick means:
Sellers pushed down the price from higher levels.
3.Lower Shadow
Thin line below body.
Shows lowest price reached.
Long lower wick means:
Buyers pushed up the price from lower levels.
How does a single candle tell a story
Let’s understand the psychology behind one candle.
Example:
Open = ₹100
High = ₹110
Low = ₹95
Close = ₹108
This tells us:
- Buyers were active
- Price fell to Rs 95 but buyers defended
- Price closed near high
- Strong bullish momentum
Every candle shows fight between buyers and sellers.
Types of Candles (Bullish and Bearish)
Bullish Candle
- Close higher than open
- Usually green
- Buyers in control
Bearish Candle
- Close lower than open
- Usually red
- Sellers in control
But color alone is not sufficient.
Size matters.
Location matters.
Context matters.
Importance of Timeframes
Candlestick charts can be viewed in different timelines:
- 1-minute
- 5-minute
- 15-minute
- 1-hour
- Daily
- Weekly
- Monthly
Intraday traders use shorter timeframes.
Swing traders use it 1H or Daily.
Investors use it daily or weekly.
Same stock.
Different timeframes.
Different story.
Always trade as per your strategy timeframe.
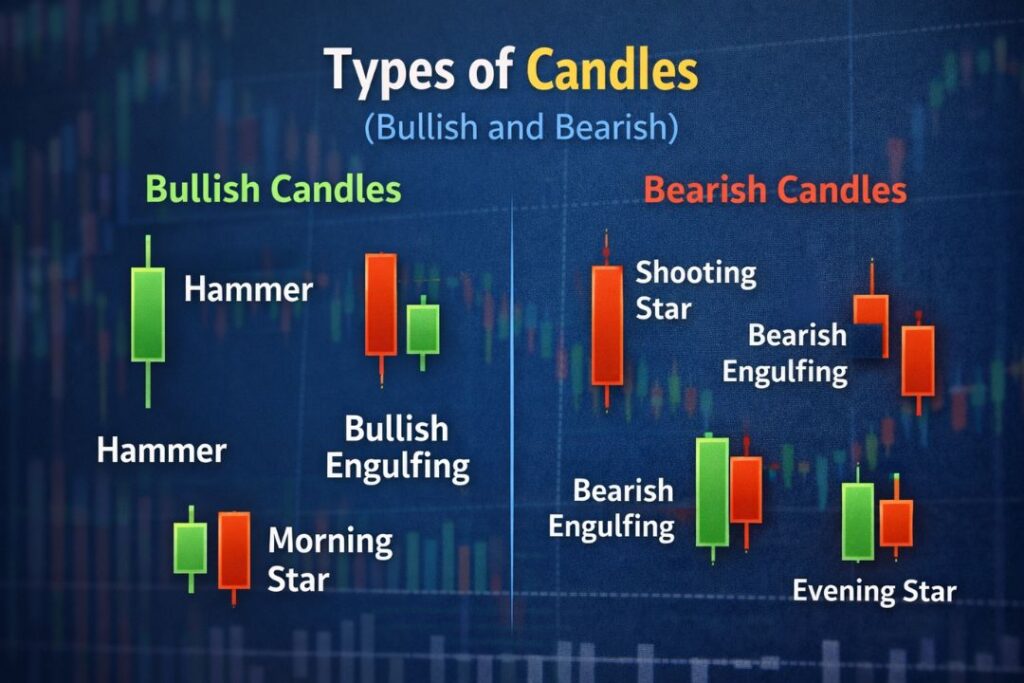
Single Candlestick Patterns
1.Doji
Small body.
Open ≈ Close.
Meaning:
Market indecision.
Appears after strong trend→ possible reversal.
2.Hammer
Small body at top.
Long lower wick.
Meaning:
Buyers rejected lower prices.
Possible bullish reversal (particularly at support).
3.Shooting Star
Small body at bottom.
Long upper wick.
Meaning:
Sellers reject higher prices.
Possible bearish reversal.
4.Marubozhu
No wick.
Full body candle.
Strong momentum candle.
Green marubozu = powerful purchasing
Red marubozu=powerful selling
Multiple Candlestick Patterns
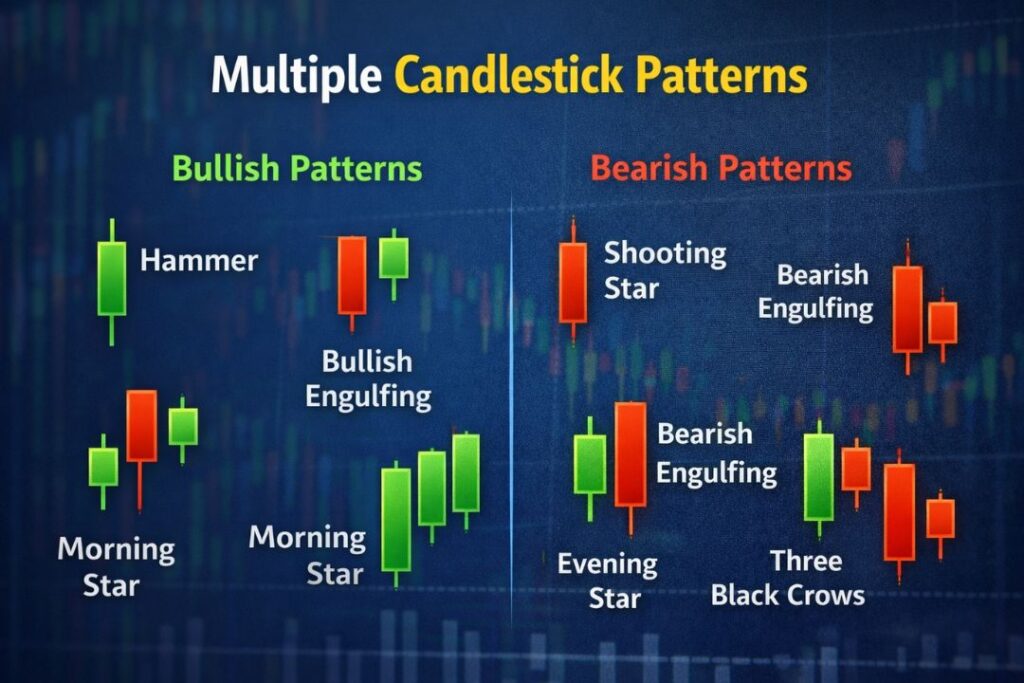
Now we move to powerful patterns formed by 2-3 candles.
1.Bullish Engulfing
Small red candle.
Next large green candle completely covers the previous one.
Meaning:
Strong buying pressure.
Trend reversal possible.
2.Bearish Engulfing
Small green candle.
Next big red candle covers previous.
Strong selling pressure.
3.Morning Star
Three candle pattern.
Signals bullish reversal.
4.Evening Star
Opposite of morning star.
Signals bearish reversal.
Step-by-Step Guide to Reading Candlestick Charts
Now practical method.
Step 1: Identify the trend
Higher highs and higher lows – Uptrend
Higher highs & lower lows – Downtrend
Never trade against the strong trend.
Step 2: Mark Support and Resistance
Support = price floor
Resistance = price ceiling
Candle stick patterns work best at these levels.
Step 3: Wait for Confirmation
Do not enter on first candle.
Wait for confirmation candle.
Patience = profit.
Step 4: Check Volume
Volume confirms strength.
High volume + breakout = strong movement
Low volume breakout = risky
Step 5: Use Stop Loss
Always define risk before entering.
Example:
If buying at support,
Stop loss below support.
Common Errors Beginners Make
- Trading every candle
- Ignoring the trend
- No stop loss
- Overtrading
- Blindly copying patterns
Candle stick reading requires context.
Advanced Understanding-Market Psychology
Candlesticks charts reflect feelings:
Fear
Greed
Panic
Euphoria
Long red candle after news?
Panic selling.
Long Green Candle After Breakout
FOMO buying.
Understanding psychology makes you a better businessman.
reading candlesticks charts with trend structure
Candlestick pattern alone works with us.
Context + Trend + Structure=High probability trade.
Market Structure
Market always should move in 3 phases:
- Uptrend
- Downtrend
- Sideways (Consolidation)
Uptrend Structure:
- Higher High (HH)
- Higher Low (HL)
Downtrend Structure:
- Lower High (LH)
- Lower Low (LL)
Golden rule:
Apply bullish patterns in an uptrend
Bearish patterns work in a downtrend
Against-trend trading is dangerous for beginners.
Candlestick charts at Support and Resistance
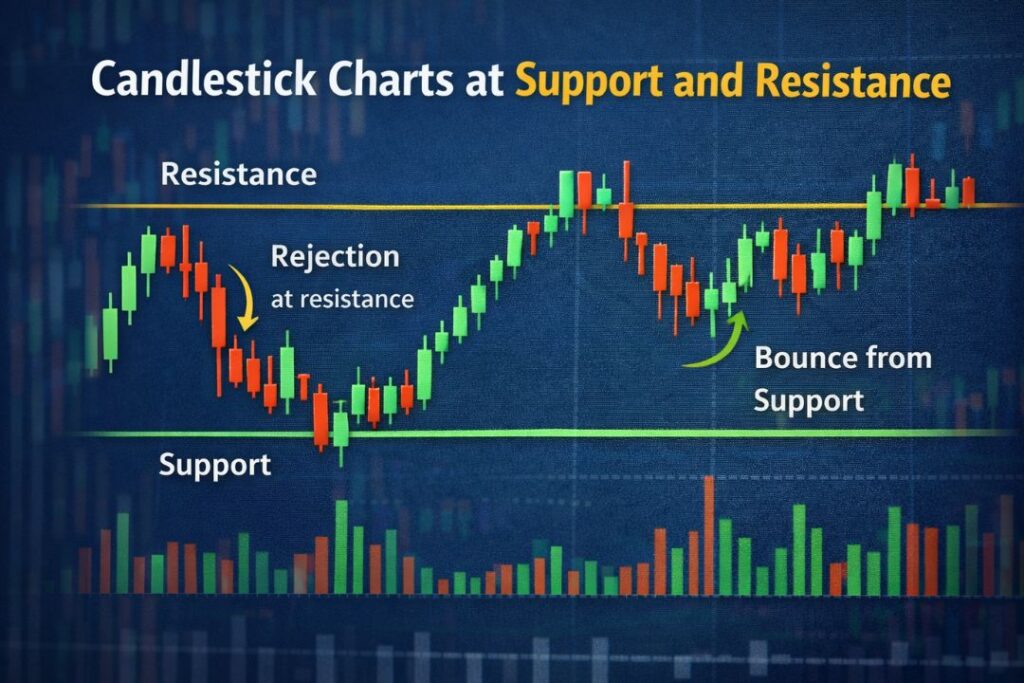
Candlestick patterns are the strongest patterns that can be used to reach major levels.
What is Support?
Support=Area where buyers enter aggressively.
Price niche will increase – there will be buying interest.
What is Resistance?
Resistance=Area where sellers are active.
Price will go up – selling pressure will go up.
Example:
Support on Hammer ban – High probability bounce
Resistance on Shooting Star – Possible reversal
Breakout Strategies with Candlesticks
Breakout trading is powerful.
But false breakout remains common.
Strong Breakout Signs:
- Large body candle
- Close above resistance
- High Volume
- Small Upper Wick
Weak breakout signs:
- Small body
- Long Upper Wick
- Low Volume
Always wait for candle closing confirmation.
Combination Candlestick charts + Volume
Volume is the fuel of the market.
Without volume, the breakout failed.
Volume Rules:
Breakout + High Volume = Strong movement
Breakdown + High Volume = Strong decline
Pattern + Low Volume = Avoid
Professional traders do not ignore the volume.
Intraday and Swing
Intraday Traders:
- 5 min / 15 min chart
- Fast decision
- Smaller targets
- Strict stop loss
Swing Traders:
- 1 hour / Daily chart
- Bigger targets
- Wider stop loss
- Trend based trading
Same pattern, different timeframe, different outcome.
Entry, Stop Loss and Target Planning
Candlestick charts should make this entry easier.
But a trade plan is necessary.
Entry Rule Example:
Bullish engulfing is formed at support.
Entry:
Next candle on high break.
Stop Loss:
Low-Niche Pattern.
Target:
Next resistance level.
Keep the risk:reward minimum 1:2.
False signals – how to avoid them
Candlestick pattern 100% accurate nathi.
Avoid false signals by:
- Avoid low liquidity stocks
- Avoid news time
- Confirm with trend
- Check higher timeframe
Higher timeframe confirmation is necessary.
Multi-Timeframe Analysis (Professional Technology)
Professional traders use a single timeframe.
Example:
Daily chart trend
1 hour chart entry timing
If daily uptrend and 1H bullish pattern→ strong setup.
Candlestick charts + Moving Average Strategies
Moving average trend line.
If price above 50 EMA:
Focus on buy signals.
If below:
Focus on sell signals.
Candlestick charts+ EMA combo is powerful.
Real Trading Example(Step-by-Step)
Let’s imagine:
Stock at ₹500
Support at ₹480
Price falls to ₹480
Hammer candle form
Volume high
Entry: ₹485
Stop Loss: ₹475
Target: ₹520
Risk = ₹10
Reward = ₹35
Risk/Reward = 1:3.5
Professional mindset is what I want.
Risk Management (most important section)
Without risk management, candlestick charts knowledge will be useless.
Golden Rules:
- Per trade risk = 1–2% of capital
- Always use stop loss
- Don’t revenge trade
- Don’t increase the position emotionally
Trading survival first.
Profit second.
Emotional control in candlestick charts trading
Common emotions:
- Fear
- Greed
- FOMO
- Revenge
Candlestick appears red and panic occurs.
Please wait for pattern confirmation.
Discipline > Strategy.
Professional framework to read any chart
When opening any chart:
1: Identify the trend
2: Mark support / resistance
3: Waiting for pattern at key level
4: Confirm with volume
5: Plan entry and stop loss
6: Define target
7: Maintenance
Simple system=consistent results.
Real Market Case Studies
Understanding theory is important, but real learning happens when you apply it to live market circumstances. Let us look at practical examples.
hammer at strong support
Scenario:
- The stock was in a short-term downtrend.
- Price reached a major support zone.
- A Hammer candlestick charts formed with a longer lower wick.
- Volume increased considerably
Interpretation:
The long lower wick showed that sellers pushed the price down, but buyers strongly defended the support level and pushed it up.
Trade Plan:
- Entry: Break of hammer high
- Stop Loss: Below hammer low
- target
Lesson:
Candlestick patterns becomes powerful when they form at key support levels.
Shooting Star at Resistance
Scenario:
- Stock was in an uptrend.
- Price reached a strong resistance area.
- A Shooting Star candle formed with a long upper wick.
Interpretation:
Buyers tried to push the price higher, but sellers dominated and forced the price back down.
Trade Plan:
- Entry: Break of shooting star low
- Stop Loss: Above shooting star high
- Target: Nearest support zone
Lesson:
Upper wick rejection near resistance frequently signals trend reversal.
Bullish Swallowing After Pullback
Scenario:
- The overall trend was upward.
- The price experienced a temporary pullback.
- A small red candle was followed by a strong green bullish swallowing candle.
Interpretation:
Buyers regained control after a slight correction.
Lesson:
Swallowing patterns work extremely well during trend continuation.
Advanced Pattern Combinations
Single candlestick patterns are helpful.
But combinations increase probability.
Combination 1:
Support+Hammer+High Volume
Strong bounce setup
Combination 2:
Breakout + Marubozu + Volume Peak
High momentum trade
Combination 3:
Downtrend + Bearish Swallowing + Moving Average Rejection
Strong short selling setup
Complete Candlestick charts Trading System (Begner Friendly)
Follow this simple structure:
1: Identify the Trend(Daily Chart)
If the trend is up → Look for buy setups
If the trend is down → Look for sell setups
2: Mark Key Levels
- Support
- Resistance
3:Wait for Pattern Confirmation
- Hammer
- Engulfing
- Marubozoo
- Shooting Star
4: Confirm with Volume
No volume = No conviction.
5: Risk Management
Risk only 1 % of capital per trade.
Example:
Capital = $10,000
1% risk = $100
Position size should be adjusted depending on stop loss distance.
Beginner Checklist before entering any trade
Before placement a trade, ask yourself:
- Is the trend clear?
- am i trading near support or resistance
- Do I have confirmation?
- Did I check volume?
- Is my stop loss defined?
- Is Risk:Reward at least 1:2?
- Am I emotionally stable?
If any answer is “No,” avoid the trade.
FAQs
1.What is a candlestick chart?
A candlestick chart shows the open, high, low, and closing price of a stock within a specific time period. This helps traders understand market direction and price behavior.
2.Are candlestick patterns reliable?
Candlestick patterns are not 100% exact. They show feasibility and work best when combined with trend, support/resistance, and volume.
3.Which candlestick pattern is best for beginners?
Hammer, Shooting Star, and Bullish/Bearish Swallowing are the easiest and most reliable patterns for beginners.
4.Could I use candlestick patterns for intraday trading?
Yes, but always use a strict stop loss and confirm signals with volume to minimize risk.
5.Do I need indicators with candlestick charts?
Indicators are optional. Candlestick patterns with proper risk management are often sufficient for beginners.
Conclusion
Learning how to read candlestick charts is one of the most important skills for any businessman or investor. These charts help you understand price movement, market psychology, and the ongoing war between buyers and sellers.
However, candlestick patterns alone are not sufficient. For better results, always combine them with trend analysis, support and resistance levels, volume validation, and proper risk management. Discipline and patience are more important than forecasting the market.
If you practice consistent, study charts daily, and follow a structured trading plan, candlestick analysis can become a powerful tool in your trading journey.
Remember – successful trading is not about being right every time, but about managing risk and staying consistent over the long term.
Disclaimer
This article is for educational purposes only and does not constitute financial or investing advice. Trading in the stock market involves risk and you may lose capital. Always conduct your own research and advise a certified financial advisor before making investment decisions.