
Introduction
In the Indian stock market, one of the most closely monitored indicators is FII and DII data. Every day, market participants traders, investors, analysts, and even long-term portfolio managers track whether Foreign Institutional Investors (FIIs) and Domestic Institutional Investors (DIIs) are purchasing or selling.
You may have frequently heard statements like:
- Market fell due to heavy FII selling
- DII buying supported the market today
- FII inflows turned the market bullish
But what precisely is FII and DII data?
Why does it matter so much?
How does it impact Nifty, Sensex, stocks and sectors?
This blog explains FII and DII data from basics to advance level, in simple language, with practical examples and real market logic.
What is FII?
Meaning of FII(Foreign Institutional Investors)
Foreign Institutional Investors (FII) are institutions or organizations based outside India that invest money in the Indian financial markets.
These institutions invested large amounts of capital in:
- Equity shares
- Futures & options
- Bonds and debt instruments
FII bring foreign capital into Indian economy
Examples of FIIs
FIIs include:
- Foreign mutual funds
- Pension funds
- hedge funds
- Insurance companies
- Sovereign wealth funds
- Investment banks
These investors manage massive global funds, often worth billions of dollars.
Why FIIs Invest in India
FIIs invest in India because:
India is a fast growing economy.
Strong corporate earning potential
Large consumer base
Stability financial system compared to many emerging markets
When India looks appealing globally, FII inflows increase.
What Is DII?
Meaning of DII (Domestic Institutional Investments)
Domestic Institutional Investors (DIIs) are Indian institutions that invest money collected from Indian investors in the stock market.
Their funds come from:
- Indian households
- Salaried individuals
- Long term savings and insurance premiums.
Examples of DIIs
DIIs include:
- Indian mutual funds
- Insurance Companies(like LIC)
- Banks
- Pension funds
DII represents domestic money in the market.
Role of DIIs in the Market
DIIs act as a stabilization force.
When foreign investors sell heavily, DIIs frequently step in to buy and support the market.
What is FII and DII data?
Meaning of FII & DII Data
FII and DII data shows:
- How much money FIIs purchased or sold in a day
- How much money DIIs purchased or sold in a day
The data is usually shown as:
- Net Buying (Buying more than selling)
- Net Sell (Selling more than purchasing)
Example of FII & DII Data
- FII:-₹4,500 crore → Net selling
- DII: +₹3,200 crore → Net purchasing
This means:
- Foreign investors sold shares worth Rs 4,500 crore
- Domestic institutions purchased shares worth ₹3,200 crore
Why is FII and DII data important?
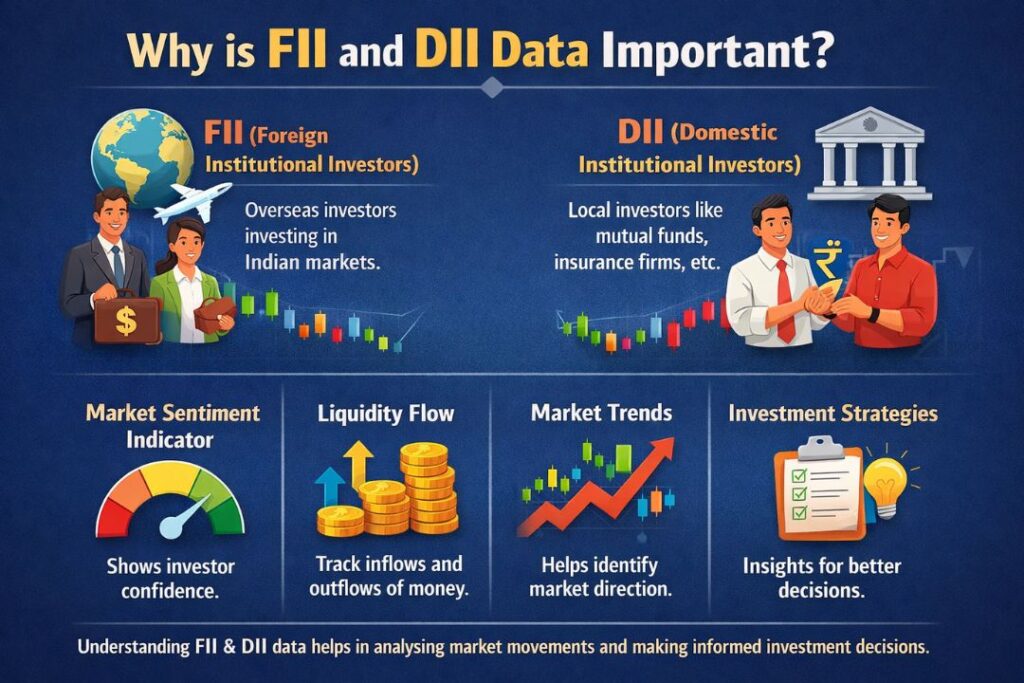
1.Indicates Market Direction
- FII buying – Market tends to go up
- FII selling-Market often falls
FIIs move large volumes, so their actions influence market trends.
2.Reflects Global Sentiment
FIIs react to:
- US interest rates
- Global inflation
- Dollar Strength
- Geopolitical events
Their behavior reflects global risk hunger.
3.Shows strength of domestic investors
Strong DII purchasing during FII selling shows:
- Confidence in Indian economy
- Long-term domestic support
This frequently limits sharp market crashes.
Effect of FII Data on the Stock Market
When FIIs Are Buying
Effects:
- Nifty and Sensex rise
- Large-cap stocks perform well
- Banking, IT, FMCG gaining strength
- Market sentiment turned bullish
FIIs prefer liquid large-cap stocks, so indexes move sharply.
When FIIs Are Selling
Effects:
- Market volatility increases
- Indices fall or move sideways
- Weak stocks correct sharply
- Fear increases amongst retail traders
Maintained FII selling can cause market corrections or bear phases.
Effect of DII Data on the Stock Market
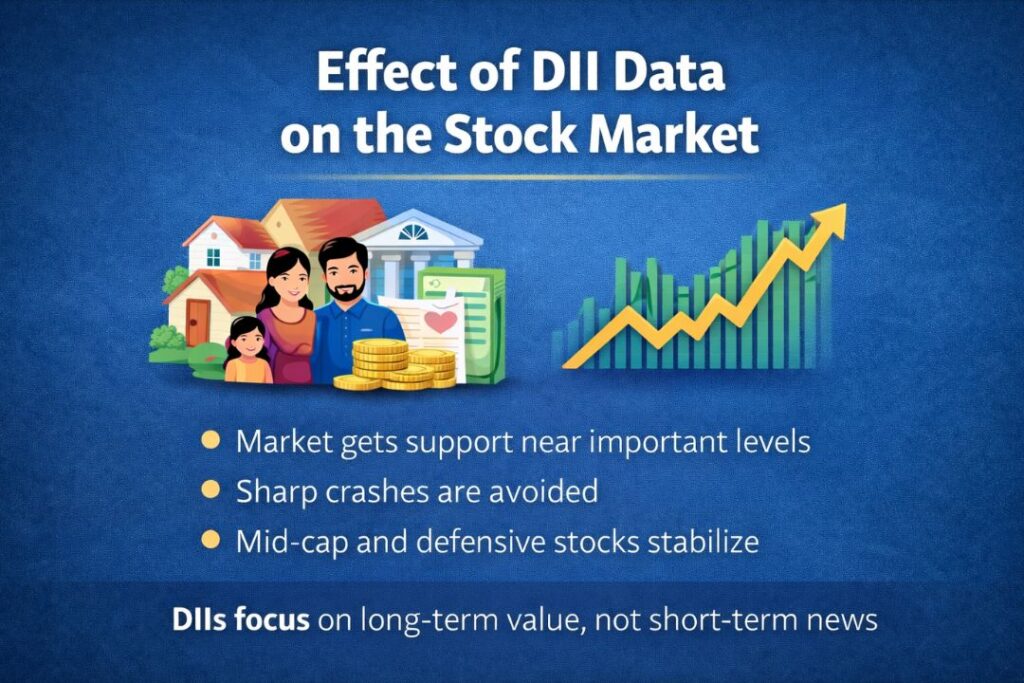
When DIIs Are Buying
Effects:
- Market receives support near important levels
- Sharp crashes are avoided
- Mid-cap and defensive stocks stabilize.
DIIs focus on long-term value, not short-term information.
When DIIs Are Selling
Effects:
- Market becomes internally weak.
- FII selling impact increases
- Confidence reduces
This is less common but important during extreme circumstances.
| Aspect | FII | DII |
|---|---|---|
| Origin | Foreign | Indian |
| Money Source | Global funds | Domestic savings |
| Time Horizon | Short to medium term | Medium to long term |
| Market Impact | High volatility | Market stability |
| Focus | Liquidity & trends | Valuation & growth |
FII and DII data in bull market
In a bull market:
- FIIs buy aggressively
- DIIs also buy but gradually
- Liquidity increases
- Valuations expand
This leads to stronger rallies and new highs.
FII and DII data in bear market
In a bear market:
- FIIs sell due to global fear
- DIIs buy selectively
- Market drops but finds support
DII prevents panic selling from turning into crashes.
Sector-wise impact of FII and DII
Sectors Preferred by FIIs
- Banking & Financials
- IT
- FMCG
- Metals during global cycles
Sectors Preferred by DIIs
- Domestic consumption
- Infrastructure
- PSU stocks
- Defensive Sectors
How Retail Traders Should Use FII and DII Data
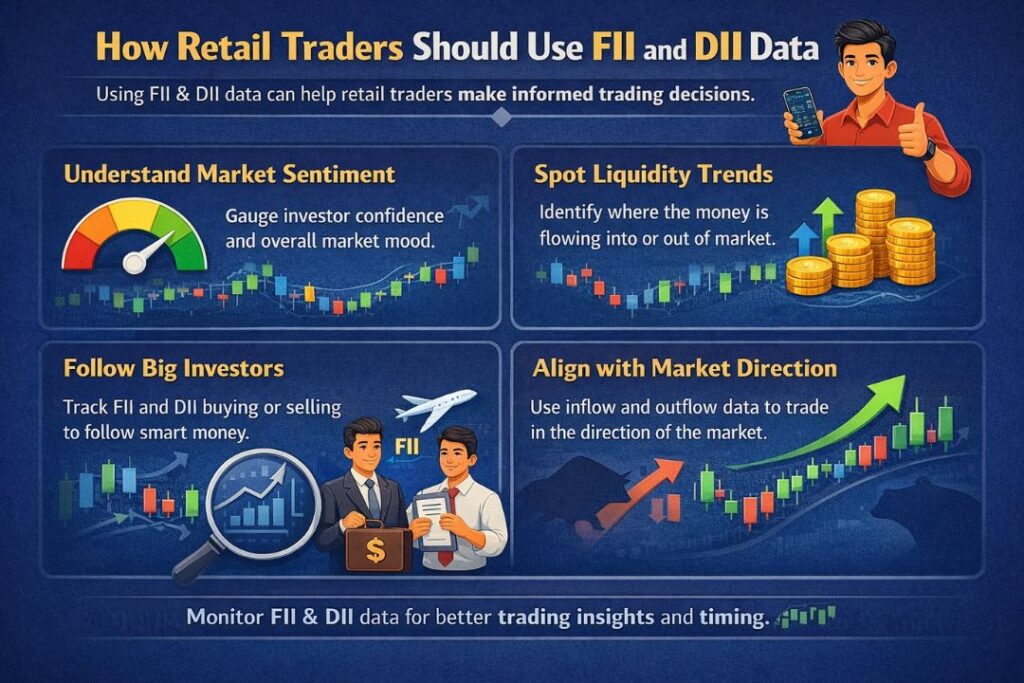
For Intraday Traders
- Use data for market bias, not accurate entries
- Heavy FII selling
For Swing Traders
- Following trends when FIIs support direction
- Avoid counter-trend trades during stronger flows
For Long-Term Investors
- FII selling stages
- DII purchasing confirms domestic confidence
Common Errors While Using FII & DII Data
- Blindly purchasing because FIIs bought one day
- Price action
- Overreacting to daily data
- Forgetting global context
FII and DII data should be used with technical and fundamental analysis.
Limitations of FII and DII data
- Data was reported after market hours.
- Doesn’t show stock specific positions
- Short-term noise can mislead
- Derivative positions are complicated
Therefore, it is a supporting indicator, not a standalone strategy.
Long-term view on FII and DII flows
Over the long term:
- India remains attractive for world capital
- Household participation is increasing.
- DIIs are becoming stronger every year.
This combination makes the Indian market more flexible.
Conclusion
FII and DII data are one of the most powerful tools to understand market sentiment.
FIIs bring global money and influence trends, whereas DIIs provide stability and long-term confidence.
Successful traders and investors do not follow this data blindly. Rather, they combine FII & DII flows with charts, fundamentals, and risk management.
Understanding these data helps you:
- Avoid emotional decisions
- Trade with market direction
- Invest with better confidence
FAQs
Q1. What does FII selling indicator do?
It usually indicates global risk aversion or negative sentiment towards Indian markets.
Q2. Could the market rise despite FII selling?
Yes, if DII buy strongly and domestic fundamentals remain strong.
Q3. Is FII data helpful for beginners?
Yes, it helps beginners understand overall market sentiment and trend strength.
Q4. Where can investors check daily FII andDII data?
Investors can check daily FII and DII data on stock exchange sites, financial news portals, and market analysis platforms after market hours.
Q5. Should retail investors follow FII and DII data everyday?
Retail investors should track FII and DII data to understand market sentiment, but they must not make trading decisions based on this data alone. It works best when coupled with technical and fundamental analysis.
Disclaimer : This article is for informational purposes only and does not constitute financial or investing advice. Stock market investing involves risk. Please do your own research or consult a financial adviser before making any decisions.
Stay connected for more such information https://stockhubnews.com